Geodog
Software
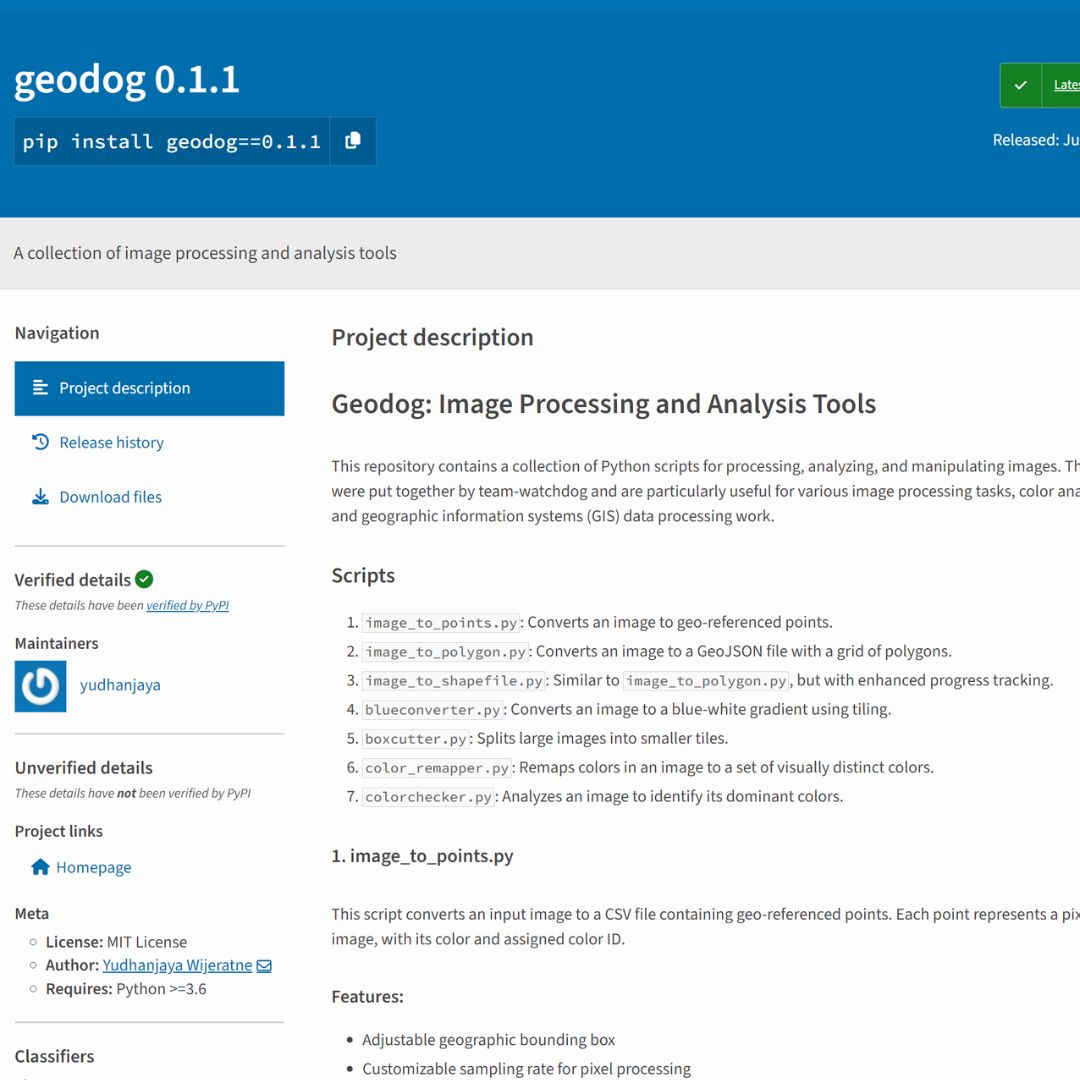
Geodog
A python library for processing images for GIS work.
geodogis a collection of Python scripts for processing, analyzing, and manipulating images. Useful for various image processing tasks, color analysis, and geographic information systems (GIS) data processing work.
geodog is available as a python library: use pip install geodog
Scripts/functionality:
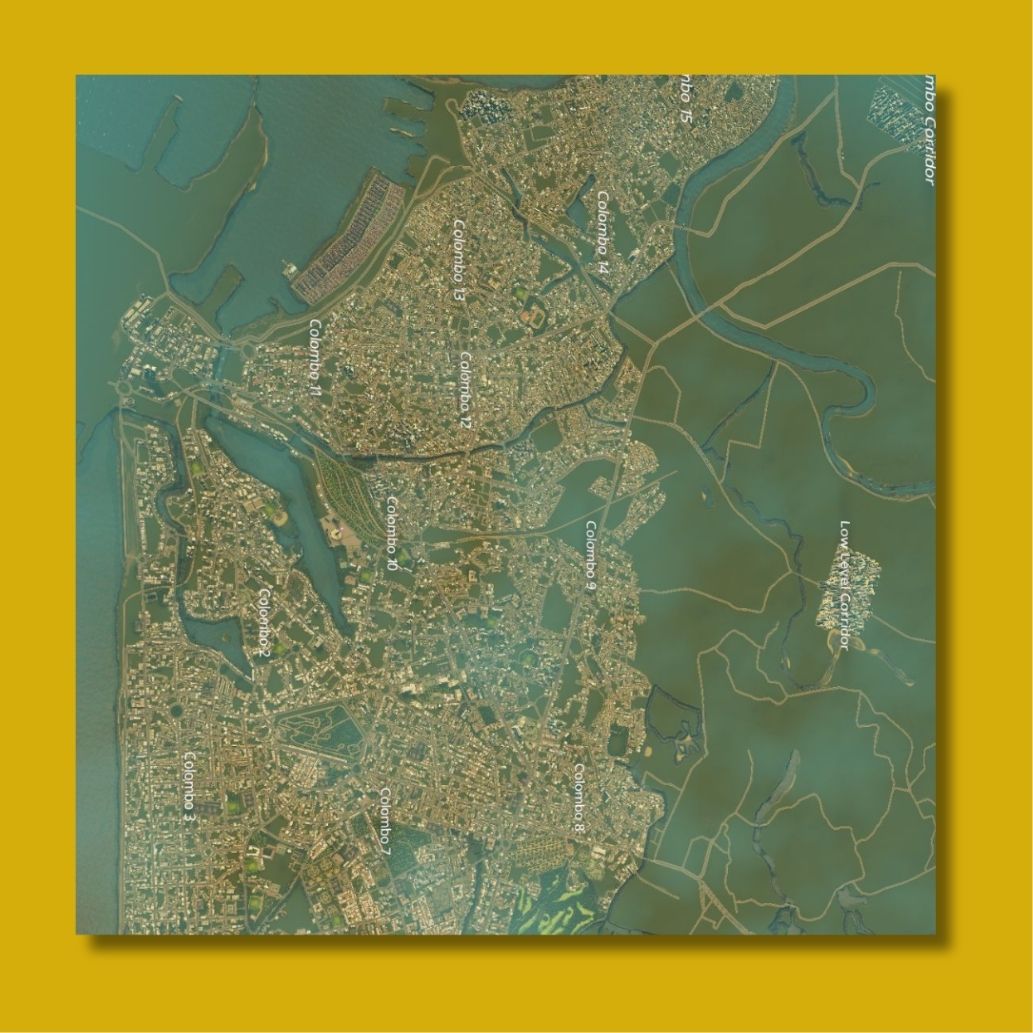
image_to_points.py: Converts an image to geo-referenced points.
image_to_polygon.py: Converts an image to a GeoJSON file with a grid of polygons.
image_to_shapefile.py: Similar to image_to_polygon.py, but with enhanced progress tracking.
blueconverter.py: Converts an image to a blue-white gradient using tiling.
boxcutter.py: Splits large images into smaller tiles.
color_remapper.py: Remaps colors in an image to a set of visually distinct colors.
colorchecker.py: Analyzes an image to identify its dominant colors.
- image_to_points.py
This script converts an input image to a CSV file containing geo-referenced points. Each point represents a pixel in the image, with its color and assigned color ID. Features:
Adjustable geographic bounding box
Customizable sampling rate for pixel processing
Color similarity threshold for grouping similar colors
Outputs a CSV file with latitude, longitude, color (in hex), and color ID
Usage:
python image_to_points.py [-h] -i INPUT_IMAGE [-s SAMPLE_RATE] [-c COLOR_THRESHOLD] [-o OUTPUT] [–nw-lat NW_LAT] [–nw-lon NW_LON] [–se-lat SE_LAT] [–se-lon SE_LON]
Arguments:
-i, --input: Path to the input image file (required)
-s, --sample-rate: Sample rate for pixel processing (default: 10)
-c, --color-threshold: Threshold for color similarity (default: 12)
-o, --output: Path to the output CSV file (optional)
--nw-lat, --nw-lon, --se-lat, --se-lon: Coordinates for the bounding box (default: Sri Lanka)
- image_to_polygon.py
This script converts an input image to a GeoJSON file containing a grid of polygons. Each polygon represents a section of the image, with its color determined by the dominant color in that section. Features:
Uses a shapefile to define the geographic area of interest
Customizable grid size for polygons
Color clustering for simplification
Outputs a GeoJSON file with polygon geometries and color properties
Usage:
python image_to_polygon.py [-h] -i INPUT_IMAGE -o OUTPUT_GEOJSON -s SHAPEFILE [-g GRID_SIZE] [-x X_OFFSET] [-y Y_OFFSET] [-n NUM_CLUSTERS]
Arguments:
-i, --input: Path to the input image file (required)
-o, --output: Path for the output GeoJSON file (required)
-s, --shapefile: Path to the shapefile defining the area of interest (required)
-g, --grid-size: Size of the grid cells in pixels (default: 10)
-x, --x-offset: X offset in pixels (default: 0)
-y, --y-offset: Y offset in pixels (default: 0)
-n, --num-clusters: Number of color clusters (default: 10)
- image_to_shapefile.py
This script is similar to image_to_polygon.py but includes enhanced progress tracking using tqdm. It converts an input image to a GeoJSON file containing a grid of polygons, with improved user feedback during processing. Features:
Identical functionality to image_to_polygon.py
Improved progress tracking for better user experience
Detailed output of processing steps and results
Usage:
python image_to_shapefile.py [-h] -i INPUT_IMAGE -o OUTPUT_GEOJSON -s SHAPEFILE [-g GRID_SIZE] [-x X_OFFSET] [-y Y_OFFSET] [-n NUM_CLUSTERS]
Arguments:
Same as image_to_polygon.py
- blueconverter.py
This script converts an input image to a blue-white gradient using tiling for efficient processing of large images. It also provides options for contrast adjustment and scaling. Features:
Tile-based processing for handling large images
Adjustable contrast and scaling
Progress tracking with tqdm
Usage:
python blueconverter.py [-h] [–tile-size TILE_SIZE] [–contrast CONTRAST] [–scale SCALE] [input] [output]
Arguments:
input: Path to the input image file (default: 'input.png' in the current directory)
output: Path to the output image file (default: 'output.png' in the current directory)
--tile-size: Size of each tile (width and height) in pixels (default: 1024)
--contrast: Contrast adjustment percentage (default: 100, no change)
--scale: Scaling percentage (default: 100, no change)
- boxcutter.py
This script splits large images into smaller tiles, which is useful for processing or displaying very large images in smaller chunks. Features:
Customizable tile size
Automatic padding for edge tiles
Progress tracking with tqdm
Usage:
python boxcutter.py [-h] [-i INPUT_IMAGE] [-o OUTPUT_FOLDER] [-s TILE_SIZE]
Arguments:
-i, --image: Path to the input image file
-o, --output: Path to the output folder for tiles
-s, --size: Size of each tile (width and height) in pixels (default: 256)
- color_remapper.py
This script remaps the colors in an input image to a set of visually distinct colors using K-means clustering. It reduces the number of unique colors in the image to a specified maximum, making the image more visually striking and easier to distinguish different areas. Features:
K-means clustering for color reduction
Customizable number of output colors
Visually distinct color palette generation
Usage:
python color_remapper.py [-h] -i INPUT_IMAGE [-o OUTPUT_IMAGE] [-n NUM_COLORS]
Arguments:
-i, --input: Path to the input image file (required)
-o, --output: Path to the output image file (optional)
-n, --num-colors: Maximum number of colors to use in the remapped image (default: 20)
- colorchecker.py
This script analyzes an input image and identifies its dominant colors using K-means clustering. It provides the color values in RGB, HEX, and HSV formats. Features:
K-means clustering for dominant color identification
Customizable number of colors to identify
Output in multiple color formats (RGB, HEX, HSV)
Usage:
python colorchecker.py [-h] -i INPUT_IMAGE [-o OUTPUT_FILE] [-n NUM_COLORS]
Arguments:
-i, --input: Path to the input image file (required)
-o, --output: Path to the output text file (optional, results printed to console if not provided)
-n, --num-colors: Number of dominant colors to identify (default: 5)
Requirements
Python 3.x
OpenCV (cv2)
NumPy
Pillow (PIL Fork)
GeoPandas
Shapely
Rasterio
scikit-learn
tqdm
Installation
Clone this repository:
git clone https://github.com/team-watchdog/geodog
Install the required packages:
pip install opencv-python numpy pillow geopandas shapely rasterio scikit-learn tqdm
License and acknowledgements
This project is licensed under the MIT License.
Next